

One of the bonus tasks of the Blockspace Race testnet, designed to test the Celestia network before the launch of the mainnet, involves conducting an analysis of our Light node. In this article, we will provide a detailed focus on how to set up a step-by-step Grafana dashboard that will monitor the performance of the system hosting the node. We will conduct a comprehensive review of the server metrics over a two-week period, as well as a small stress test by sending PayForBlob transactions from the node.
1) Configure Grafana dashboard with data from a Prometheus agent
We will use various services and tools to collect and transmit all the data and metrics from our node to Grafana. This way, we can utilize a ready-to-use dashboard to monitor our system and perform our analysis.
1) Create a Grafana Cloud account and get and API key
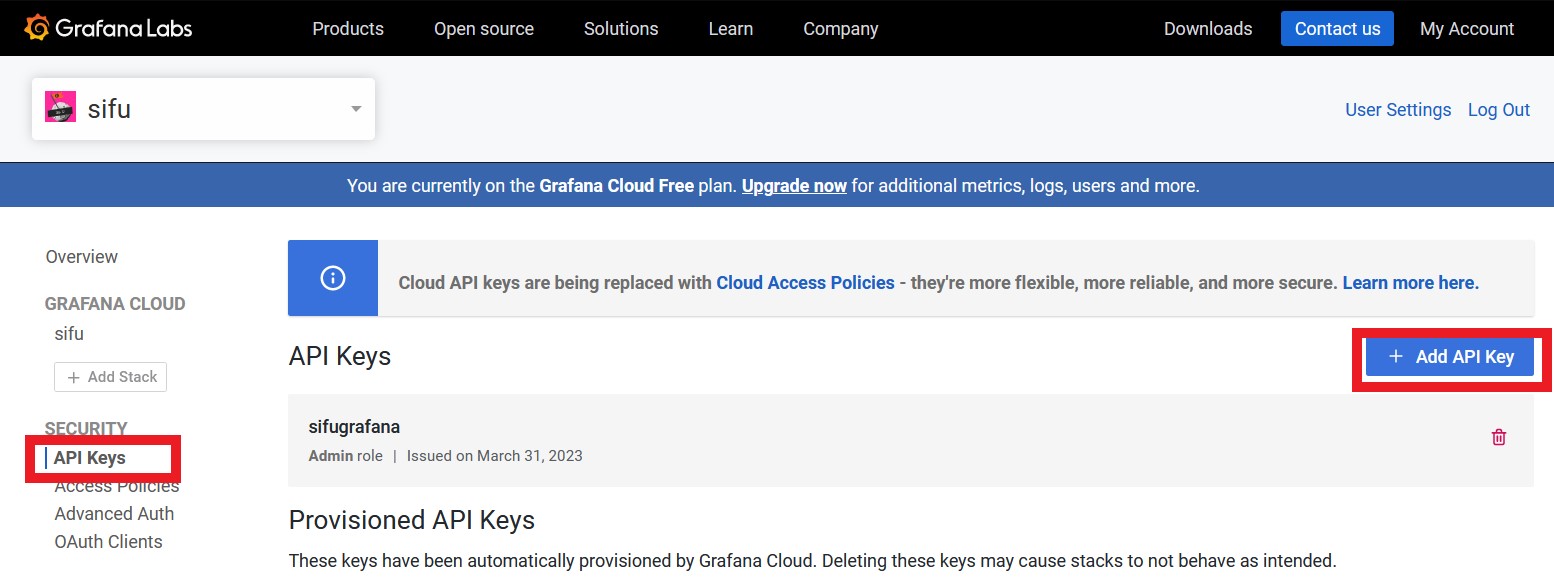
Firts of all we will go to grafana.com to register a new account. After account validation go to « My Account » and « APIKeys » in the sidebar. On the panel clic « +Add API Keys »
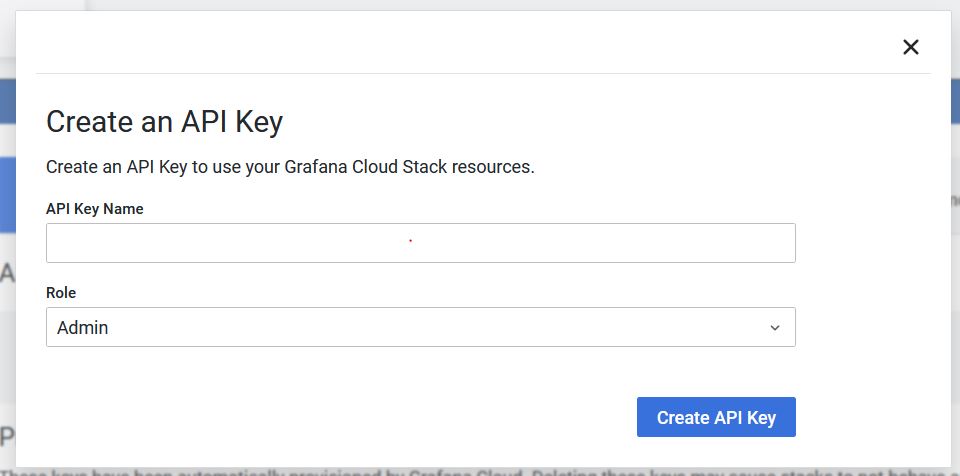 Create your new API Keys and save the token that will be provided to you :
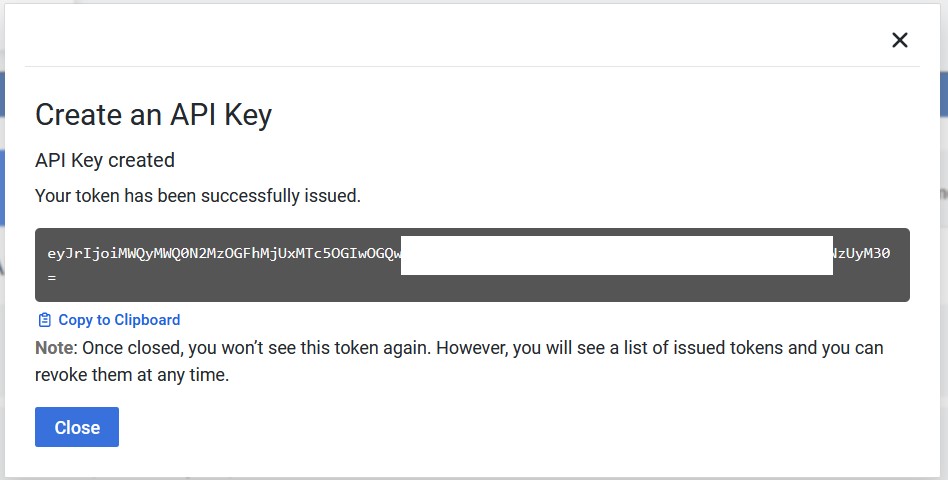
Do not forget to keep your token safely somewhere on your desktop, we will use it later.
2) Install node_exporter on the node server
We will first install node exporter from prometheus in order to collect metrics and data from the node server.
On your server get the last node_exporter binary :
wget https://github.com/prometheus/node_exporter/releases/download/v1.5.0/node_exporter-1.5.0.linux-amd64.tar.gzExtract it :
tar xvfz node_exporter-1.5.0.linux-amd64.tar.gzMove it on /usr/local/bin/ :
mv node_exporter-1.5.0.linux-amd64/node_exporter /usr/local/bin/node_exporterLaunch it :
node_exporterTo verify the installation, open an other terminal and check if the node-expoter is working correctly with this command :
curl http://localhost:9100/metricsIf it’s all good you will see data like this :
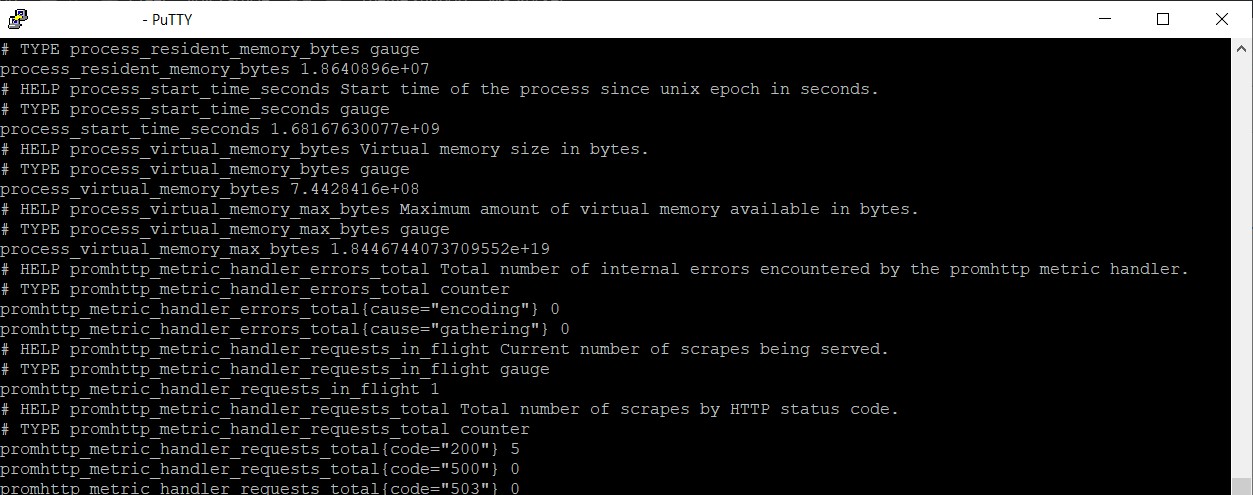
We now need to create a service :
tee <<EOF >/dev/null /etc/systemd/system/node_exporter.service
[Unit]
Description=node_exporter

[Service]
User=$USER
ExecStart=/usr/local/bin/node_exporter
Restart=always
RestartSec=3
LimitNOFILE=65535

[Install]
WantedBy=multi-user.target
EOF
Enable the service and start it :
systemctl enable node_exporter.service
systemctl start node_exporter.service
Lets curl it to check if everything is working correctly :
curl http://localhost:9100/metrics3) Install Prometheus
Now we will install prometheus on the node server.
Get the last node_exporter binary :
wget https://github.com/prometheus/prometheus/releases/download/v2.43.0/prometheus-2.43.0.linux-amd64.tar.gzExtract it :
tar xvf prometheus-2.43.0.linux-amd64.tar.gzGo into the folder:
cd prometheus-2.43.0.linux-amd64Go to your grafana account and click « Send metrics »
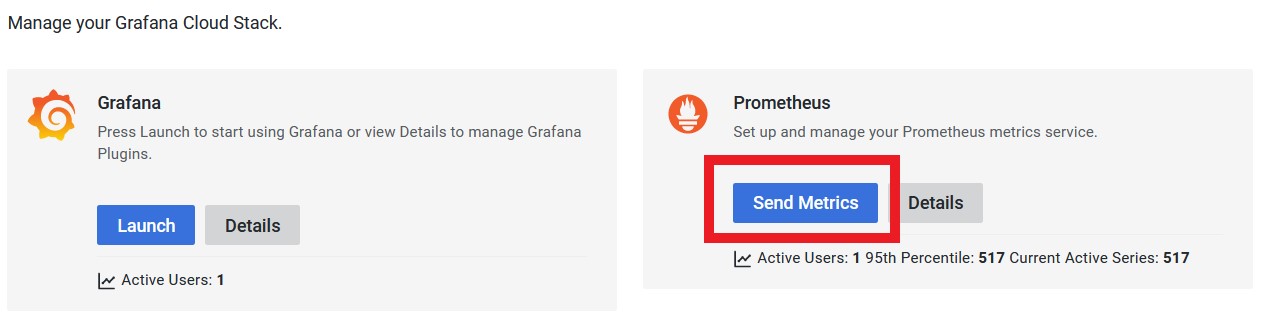
And get your « Prometheus remote_write Configuration »
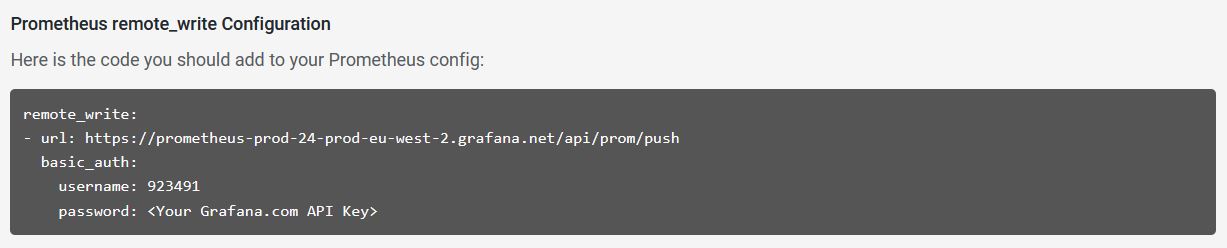
Create the configuration file on your server and to copy your full remote_write data and change your API key :
tee <<EOF >/dev/null $HOME/prometheus-2.43.0.linux-amd64/prometheus.yml
global:
  scrape_interval: 15s

scrape_configs:
  - job_name: prometheus
    static_configs:
      - targets: ['localhost:9100']

remote_write:
  - url: 'Your endpoint'
    basic_auth:
      username: 'Your Grafana Username'
      password: 'Your Grafana API Key'
EOF
Create a service to run it on the server :
sudo tee <<EOF >/dev/null /etc/systemd/system/prometheus-agent.service
[Unit]
Description=Prometheus Agent

[Service]
User=$USER
WorkingDirectory=$HOME/prometheus-2.43.0.linux-amd64/
ExecStart=$HOME/prometheus-2.43.0.linux-amd64/prometheus --config.file=./prometheus.yml
Restart=always
RestartSec=3
LimitNOFILE=65535

[Install]
WantedBy=multi-user.target
EOF
We need to enable the service and start it :
systemctl enable prometheus-agent.service
systemctl start prometheus-agent.service
That it, we now have a good configuration for your server to send all his metrics to Grafana.
3) Create a Grafana Dashboard
Now we will generate a Grafana dashboard,to have a good data visualization.
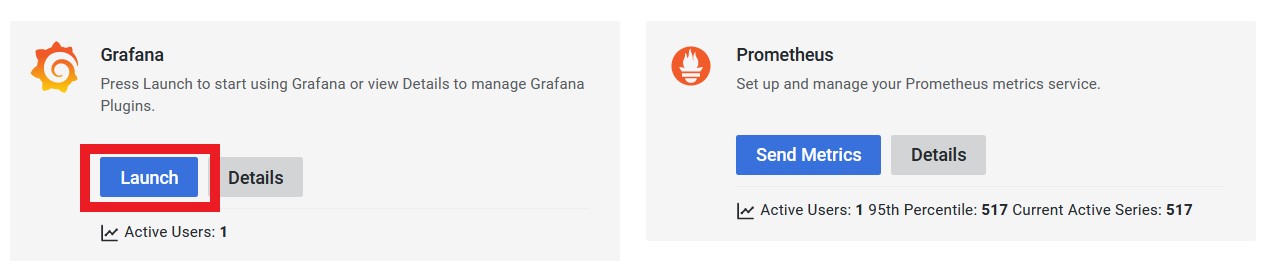
On your grafana account click « Launch » on the Grafana panel :
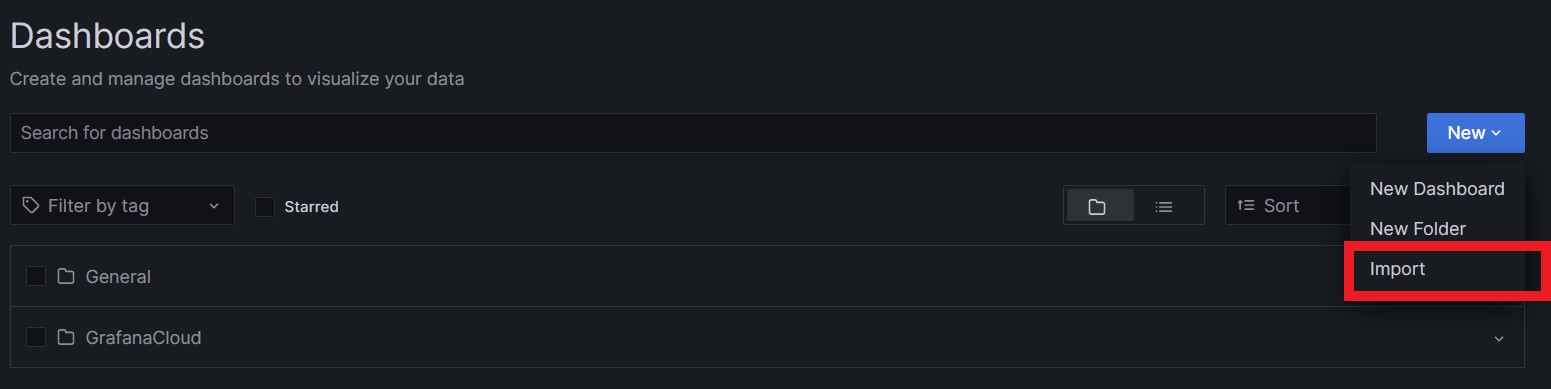
Clic the « dashboard » menu on the left sidebar :
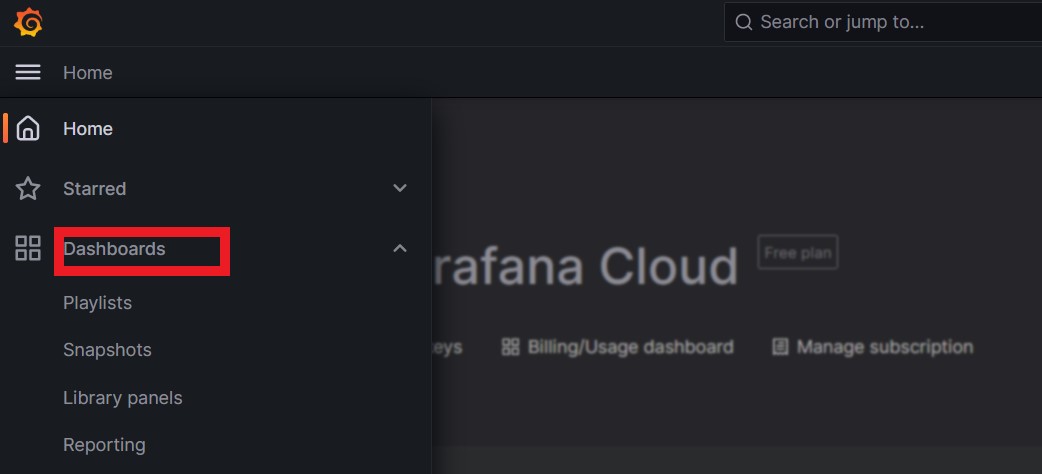
Clic « New » and « Import » :
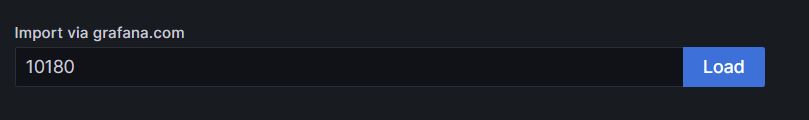
Enter the ID number 10180 into the box and click Load
You will now automatically get a nice Linux Host Metrics dashboard:
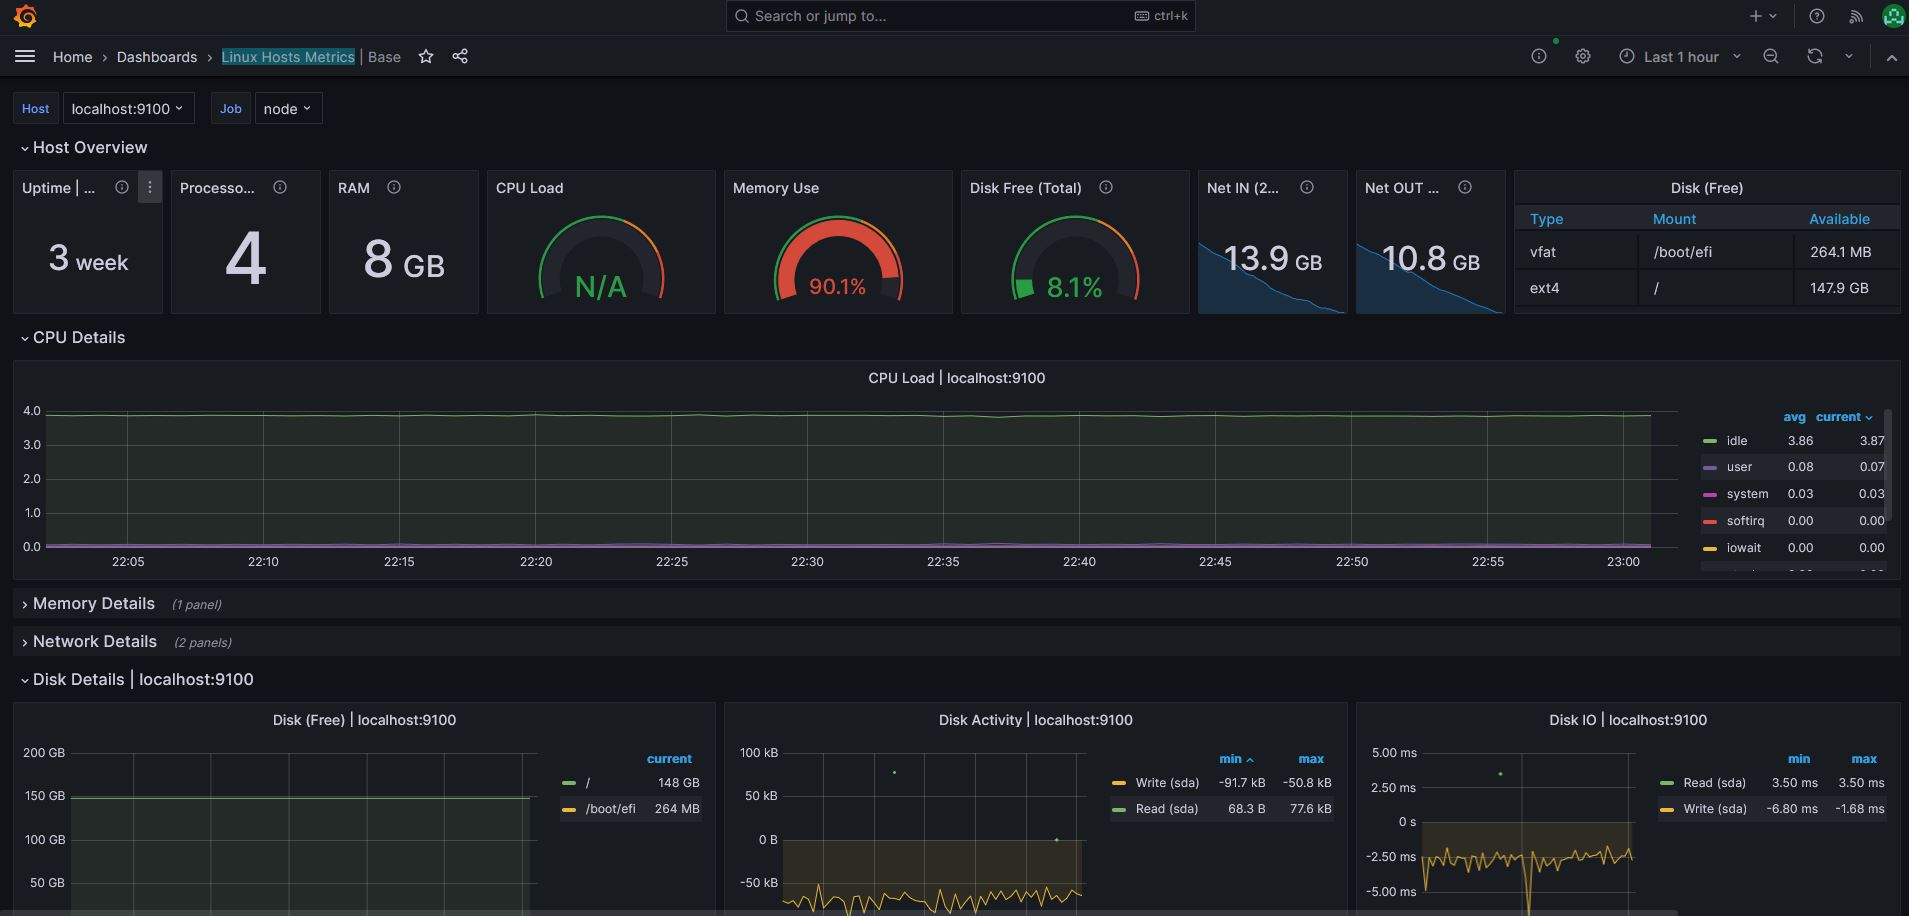
We now have everything we need to perform our node analysis.
2) Analysis of the node
For a quick reminder the minimum hardware requirements for running a light node:
- Memory: 2 GB RAM
- CPU: Single Core
- Disk: 25 GB SSD Storage
My choice has gone on a CPX31 form Hetzner provider for a reliable and stable VPS for this testnet on Ubuntu 20.04.6 LTS with the hardware :
- Memory: 8 GB RAM
- CPU: 4 vCPU
- Disk: 160 GB SSD Storage
Global stats
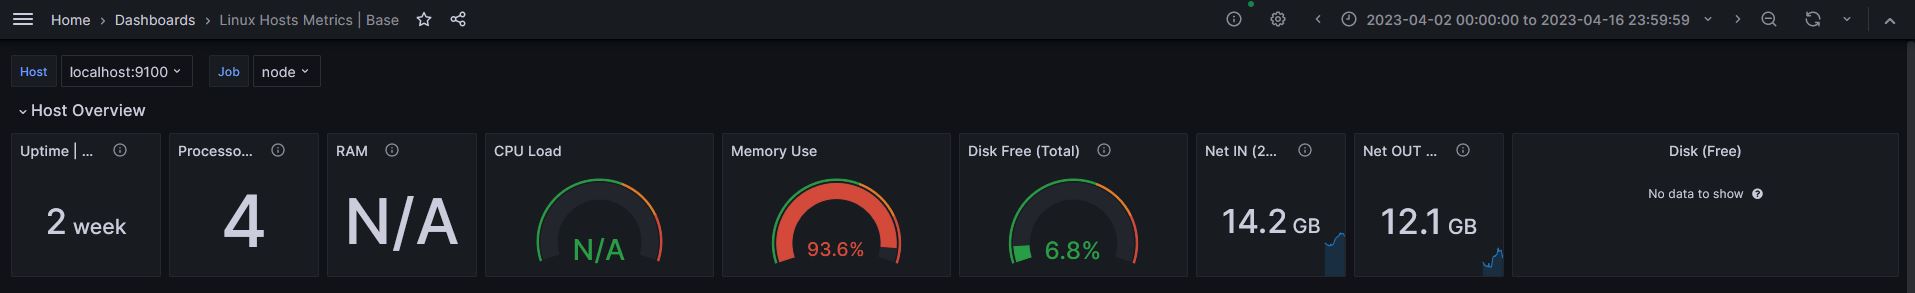
I will use a 2 week snapshot for the analysys of the node from the April 2th to the April 16th.
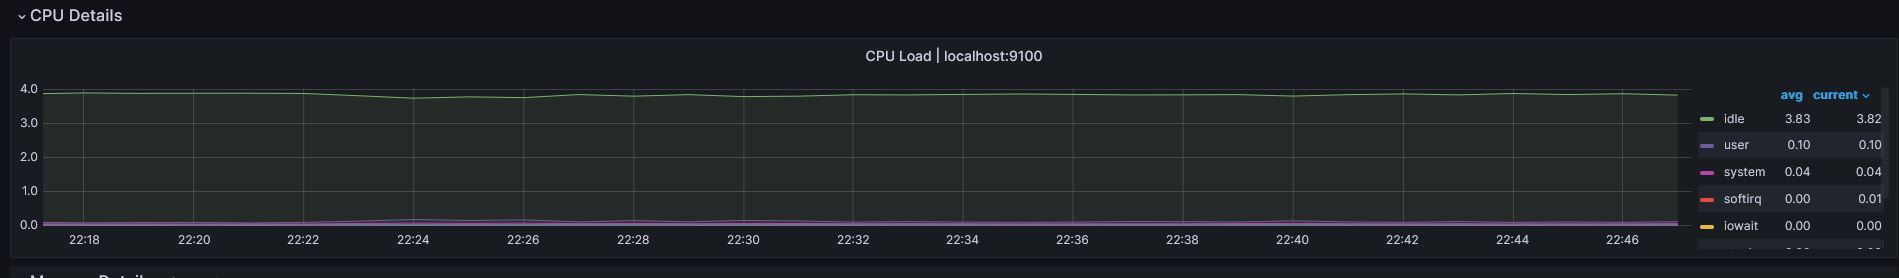
CPU
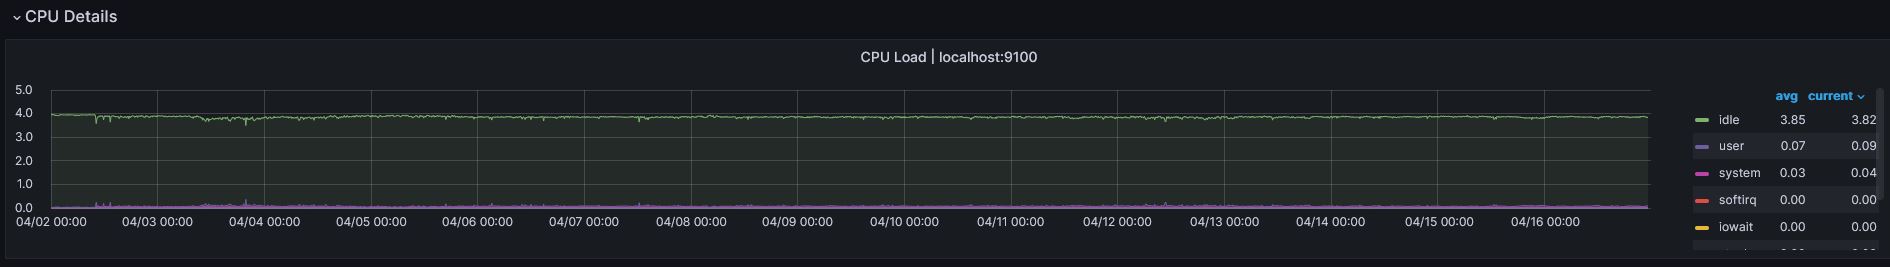
We can observe that the CPU load is relatively low, with an average of 4% used by the entire system. As expected, the server is oversized, so the server appears to be relatively calm.
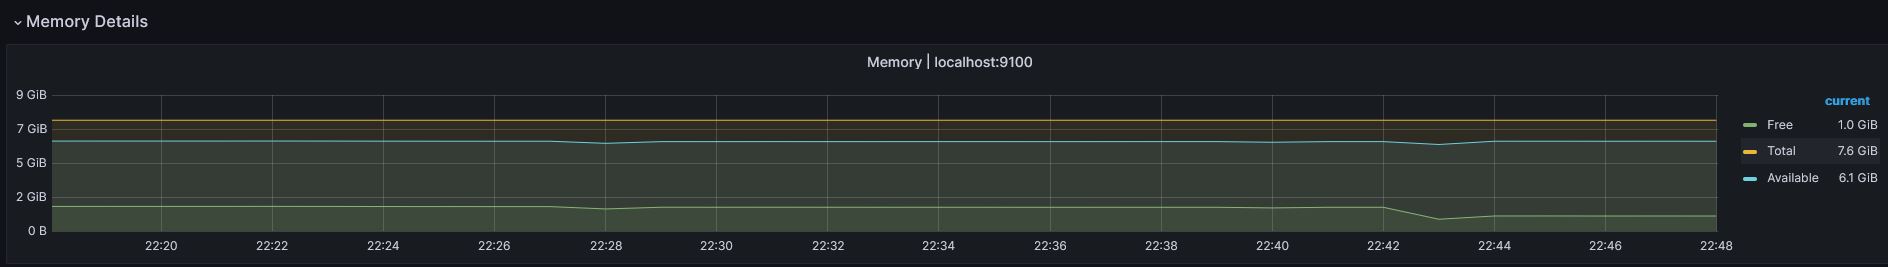
RAM
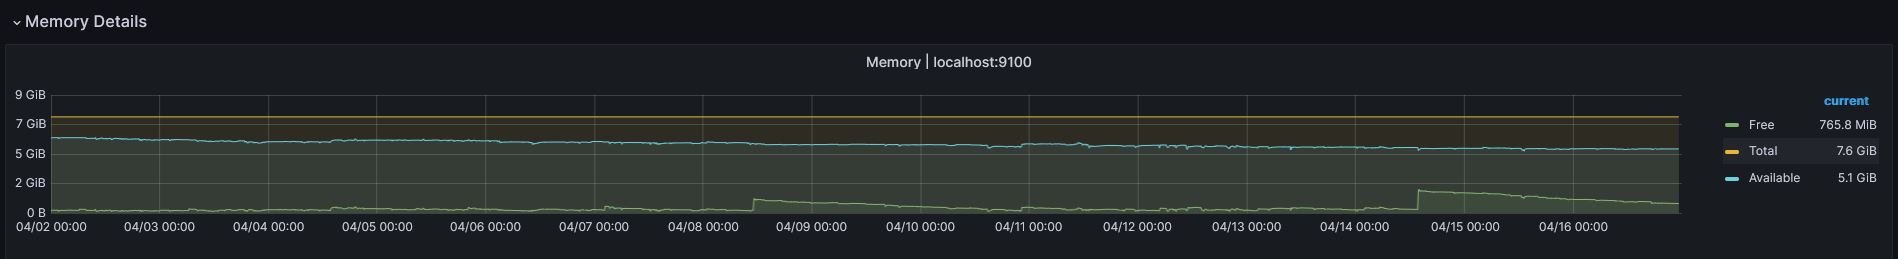
As we can see the free and available RAM for the server was very large with at least 5GB always available. On this point too, the server is oversized, but for the minimum requirements, I would recommend going for at least a 4GB minimum for a mainnet node, as the volume of activity will be significantly different.
Disk
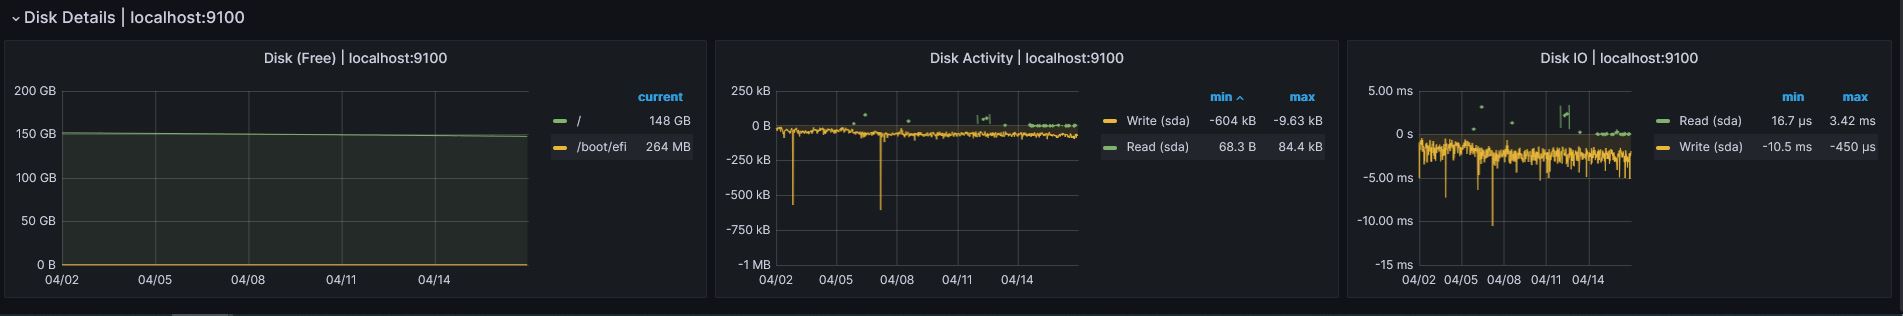
The disk also is oversized but we can observe that wil are using a total of 12GB on the server. We go for a direct review of the space used by the Celestia Light Node with the commande
du -hs- directory « .celestia-app » : 12Ko
- directory « celestia-node » : 283M
- directory « .celestia-light-blockspacerace-0 » : 5.9G
The last directory is to one which contains data from, as we are on a testnet with low activity i will also go on a minimum 80GB ssd disk for a mainet to be safe to roll.
Network
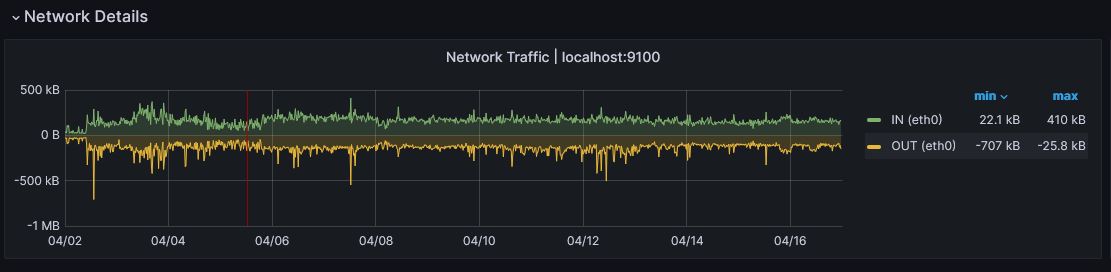
The network too go a very low demand, we will send somes PFB trsnactions to see how it goes on the final step of this analysis.
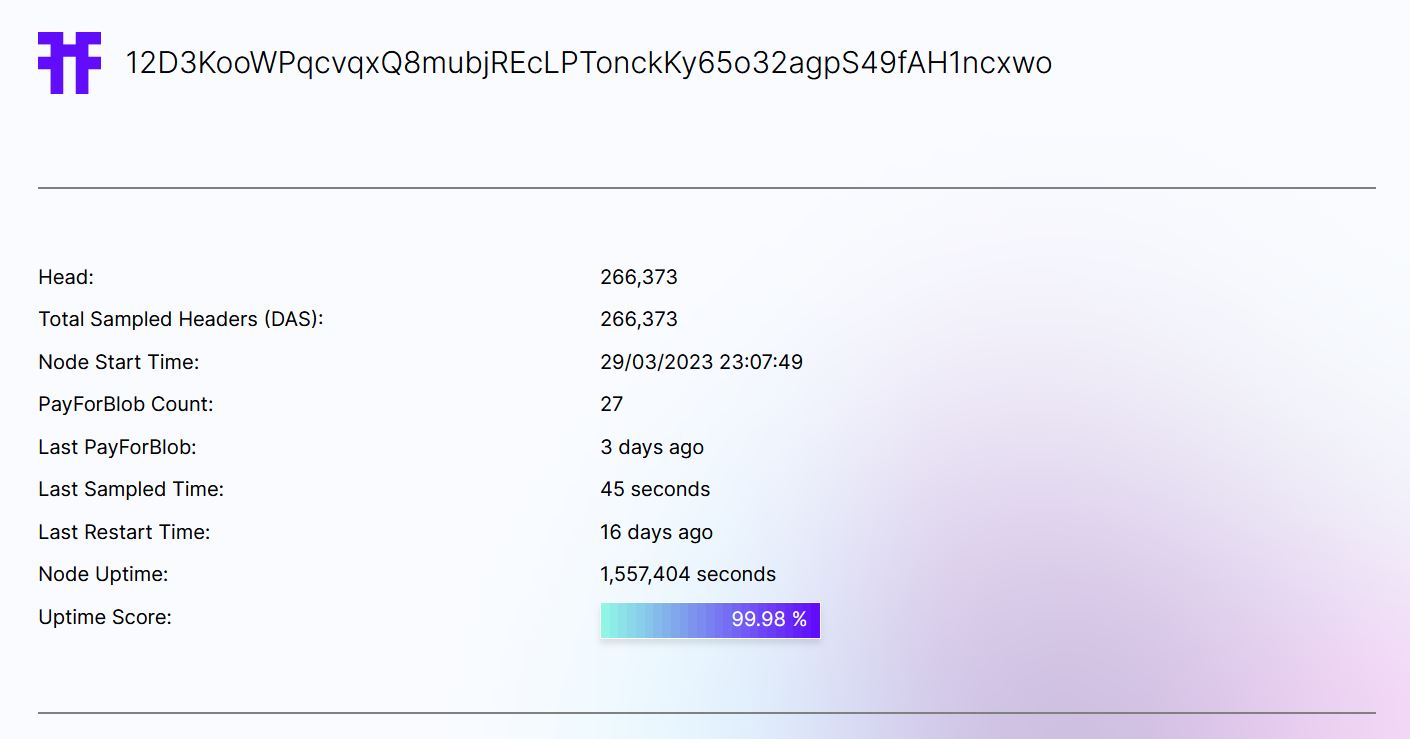
Tiascan
Here a screenshot of the node’s Tiascan page, we can observe & 99,98% uptime. I suspect a none perfect calculation as the node has been fully online all the time. I may also depend of the RPC endpoint used.
3) Stress test
Now, we will focus on a short timeline where we will send 100 PFB transactions from the node using a simple script to see how it will react. The transactions will be sent one after the other for this small stress test. The idea is not to test the server’s capacity limits, as we may quickly run out of TIA tokens, and risk losing a good uptime score.
Here is the simple shell script used thaht you can get on this Github repo:
#!/bin/sh

a=1

while [ $a -lt 100 ]
do
   echo "PFB number $a"

curl -X POST -d '{"namespace_id": "00000000dab4f48e",
  "data": "59417467574f7a76414c6659566766446a716467526256644b6770676b67",
  "gas_limit": 80000, "fee": 2000}' http://localhost:26659/submit_pfb

   a=`expr $a + 1`
done
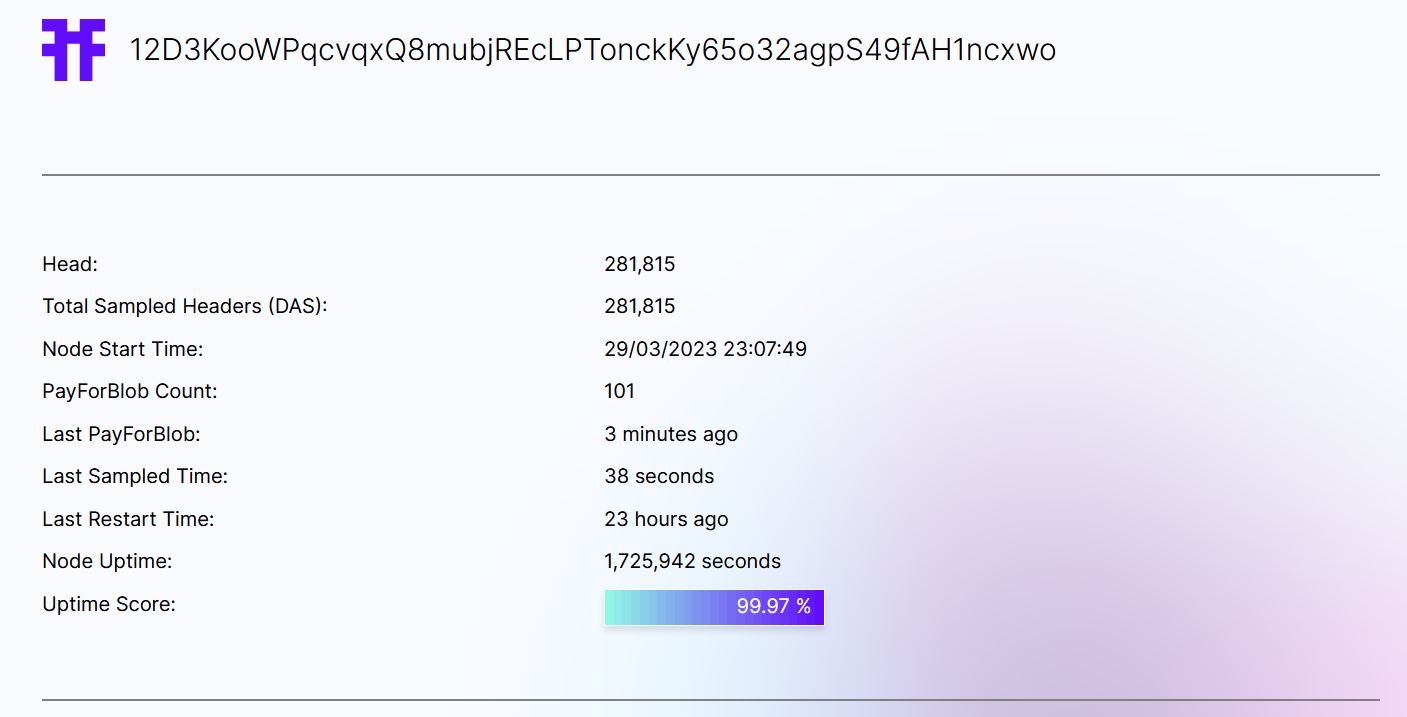
Before the test the node had Node blance : 49910000 TIA and after it remains 49712000 TIA. The test was launch the 18th april 2023 at 22h22 and finished at 22h39. we can assume a 10,2 sec response time for each PFB transation.
Here the Tiascan page after the test :
Now we can take a look as the server metrics.
CPU
We can observe a litlle push for the user cpu usage but absolutly nothing to be afraid of.
RAM
Exactly the same for the memory usage.
Network
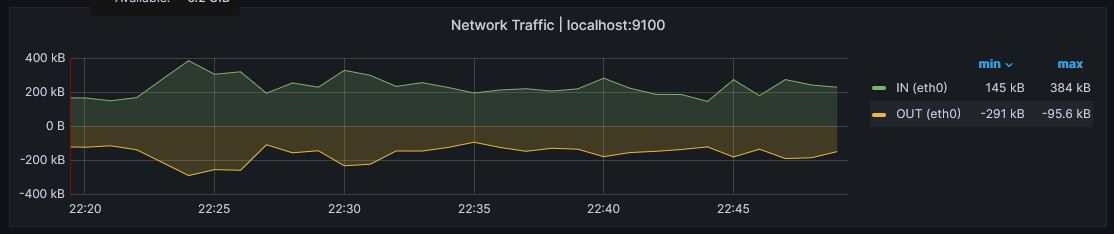
We can observe a relative augmentation of the network traffic as we are sending all these PFB transaction, nut one again noting to be afraid of.
DISK
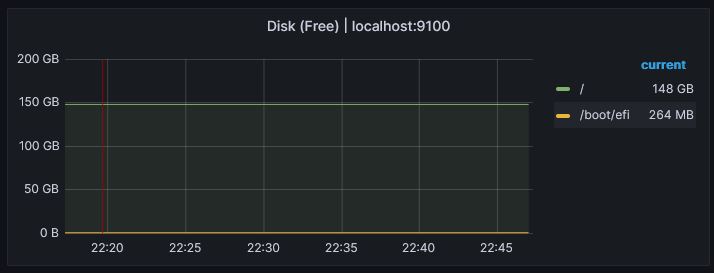
With the data repository
- directory « .celestia-app » : 12Ko
- directory « celestia-node » : 283M
- directory « .celestia-light-blockspacerace-0 » : 5.9G
No change for the disk usage as we can expect from this activity test.
Final word on this analysis
This analysis of the light node and the stress test do not highlight any weakness from the server. I totally agree that this system is totally overkill for the requirements of a light node. However, I think it is still worthwhile to choose a server that is slightly overclocked for the minimum requirements. A server of this type seems to me to be a good option to run a light node on the mainnet:
- Memory: 4 GB RAM
- CPU: 2 vCPU
- Disk: 80 GB SSD Storage
I hope that this analysis coupled with the step by step guide to configure a Grafana dashboard to monitor your server’s metrics will have allowed you to perform the same operations and to go further!


")


